Maps are powerful political tools shaping a nation’s past, present and future – counter maps allow everyday people to reclaim the narrative
Published in Political News

Throughout time, maps have been useful tools for those in power to stake their claim over territories and markets. Politicians start nationwide redistricting battles to ensure partisan control, weakening the power of voters. The Trump administration’s geopolitical posturing over Greenland builds on a long history of imperialism aided by maps. And in ancient Rome, the Peutinger map depicted vast ideas of empire by placing Rome at the center of the world.
But maps can also tell hidden stories about politics and power that help people reclaim access to their own spaces and futures. These include counter maps – that is, maps that rework existing assumptions – to expand on the dominant narratives about a place to include viewpoints that were previously excluded.
As an urban and architectural designer, mapper and spatial politics researcher, I’ve seen how maps shape urban spaces and the stories told about them. I’ve also seen how maps have the power to question these stories, opening up other meanings a place can have that are shared by everyday residents and workers.
More than just digital wayfinding aids, maps are strategic tools of world-building. Maps show how certain ideas and boundaries that people may think are fixed can be rendered flexible. Anyone can make a map, and because maps are instruments of spatial storytelling, the possibilities they reveal about places are actually endless.
Geographer Mark Monmonier famously described how to lie with maps. He pointed out that mapmakers who have power, like governments and companies, use selective editing to advance specific goals or disseminate a brand.
The Shell Oil road maps of the 1950s are a useful example of maps as marketing. With a large logo on the front and the Shell north star compass on the inside, these maps were provided free in gas stations across the country. They advertised the brand while facilitating auto travel by delineating roads and major features, including mileage charts on the backs so motorists could plan gas stops. The maps omitted competing transit systems like bus routes.
Public agencies and public-private partnerships also advance agendas via maps. The Home Ownership Loan Corporation redlined maps of the 1930s show even more directly how the government and real estate industry used maps to exclude certain communities. These maps were made for almost every major American city, and the zones they marked as risky for lenders coincided with neighborhoods where African Americans lived, thus taking them out of the home ownership market.
One can look today to gerrymandering efforts in states like Texas and Florida to see how maps are used to control who has access to the levers of democracy. These redistricting cases were done outside of a typical census year in order to win more congressional seats in the 2026 elections.
If maps are used to systematically shut minority neighborhoods out of property markets, then remapping these systems can reveal how the strings of government and private industry are pulled to exclude these neighborhoods, and whom this exclusion benefits.
In my book “Radical Atlas of Ferguson, USA,” I remap this American city to show what happens behind the scenes in regional and municipal planning, revealing why such stark conditions of inequality persist there.
The suburb of Ferguson, in North St. Louis County, Missouri, made it into the national spotlight in 2014 after a white police officer shot and killed Michael Brown Jr., an unarmed Black teenager. The community response to this injustice helped to spur the Black Lives Matter movement.
With the maps in this book, I layered in new stories to unpack the strained political and economic context underlying Ferguson. For example, historian Walter Johnson points out that there are several major Fortune 500 companies located just blocks from where Brown was killed. While those companies receive heavy tax subsidies and public development incentives for their physical growth, the rest of the municipality’s spending for necessities like public schools and sidewalks remains underfunded. By highlighting these facets of the landscape, maps can show who actually controls the imaginations of urban planners and politicians.
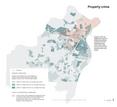
Remapping helps policymakers become more aware of biases within the data they use for mainstream neighborhood assessments and municipal map-making. Maps showing seemingly objective crime data, for example, often reinforce ideas of risk in minority neighborhoods. But when property crime in North St. Louis County, where a majority of Black residents live, is overlaid with the white-collar mortgage fraud crimes of 2008 – a dataset not readily available in typical municipal catalogs – it becomes evident how this area was targeted by subprime mortgage lenders. Broadening how people evaluate data and its sources can shift attention to the underlying forces shaping the statistics.
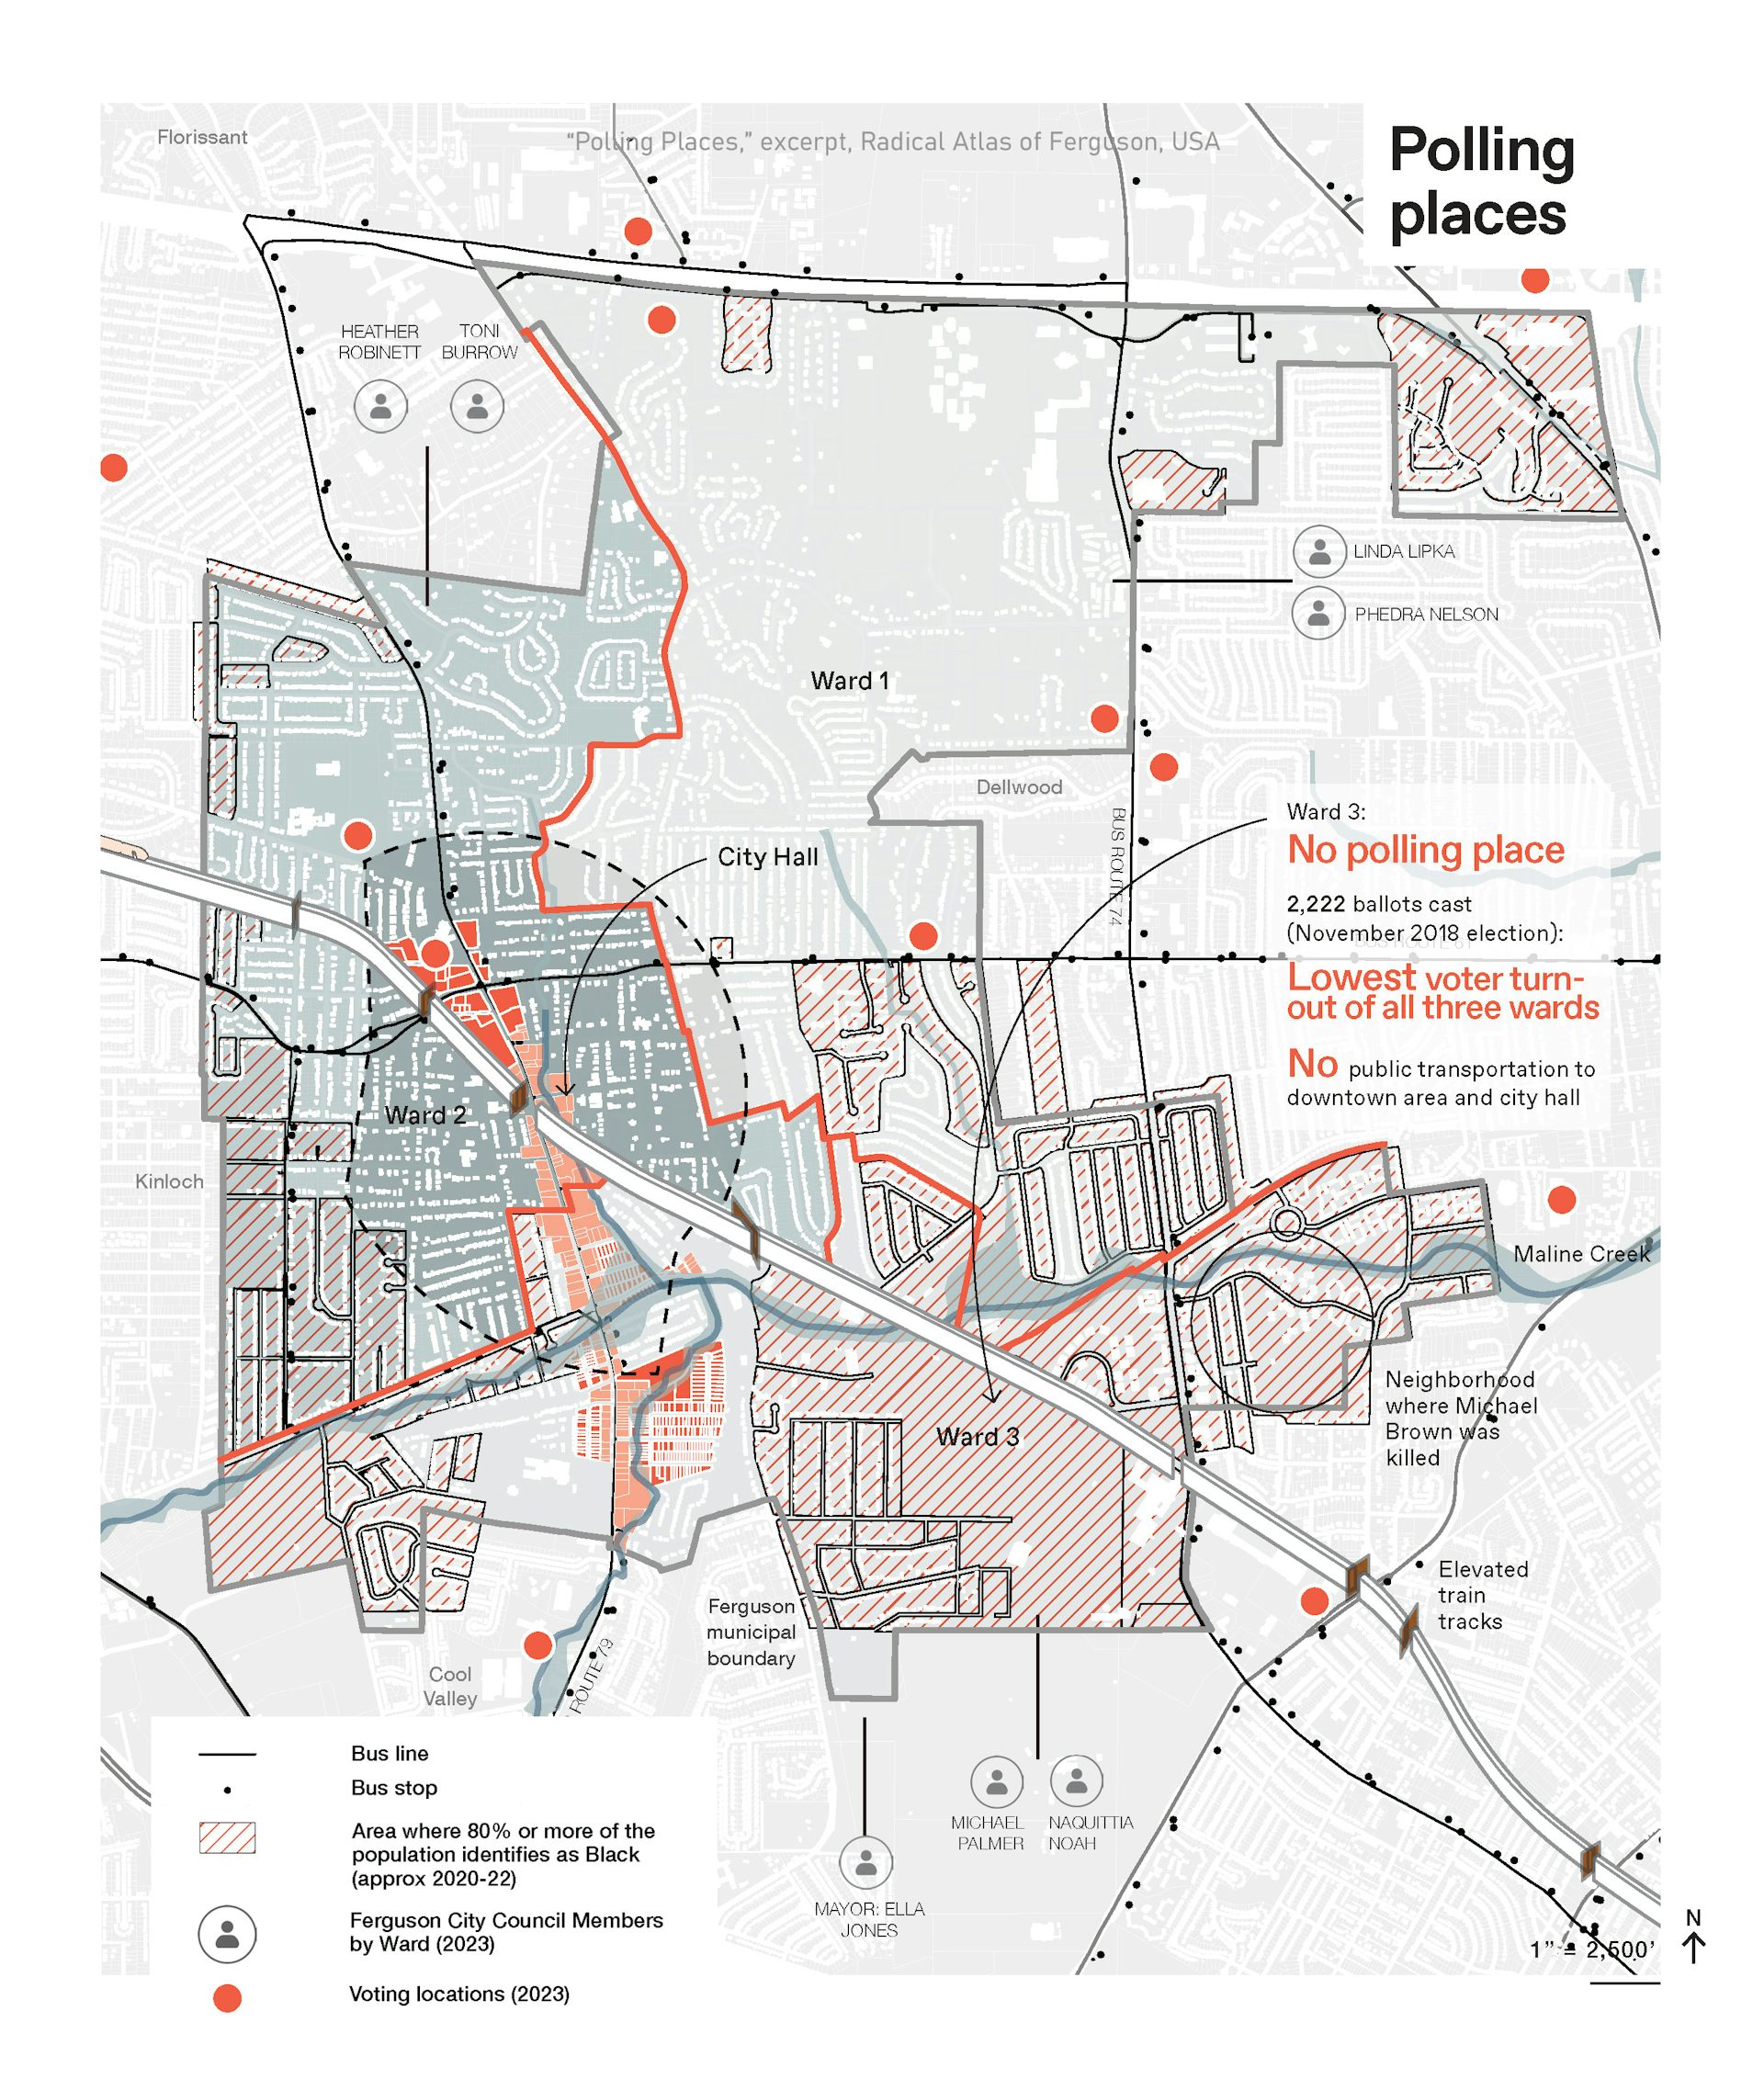
Remapping can also combine layers of seemingly unrelated information to discover new links between spatial details. For example, why is voter turnout so low in the ward where Brown was killed? A map of racial demographics combined with polling locations reveals there is not only no polling place in the majority African American ward, but also physical barriers – including an elevated rail line and stream corridor – that prevent residents from easily accessing City Hall and other polling places.
As those in power continue to politicize maps, the practice of remapping can serve the broader public by making those systems of power more visible to everyone.
Counter maps have inspired activists to edit previously omitted information back into mainstream accounts. Mapmaker Andrew Middleton introduced me to one example: a petrofuturist view of the Shell Oil maps. These counter maps show the roads documented in the Shell Oil maps underwater based on projected sea level rise due to climate change – which is caused predominantly by the burning of fossil fuels produced by companies including Shell.
Maps are scaled geographical projections, ensuring legibility and usefulness. They are understood by people of all ages. They communicate graphically across languages, and they’re portable. When maps and counter maps uncover and layer the otherwise unseen relationships that shape a place, they assert new forms of collective memory, offering more meaningful versions of public authority.
This article is republished from The Conversation, a nonprofit, independent news organization bringing you facts and trustworthy analysis to help you make sense of our complex world. It was written by: Patty Heyda, Washington University in St. Louis
Read more:
Women have been mapping the world for centuries – and now they’re speaking up for the people left out of those maps
From flammable neighborhoods to moral hazards, fire insurance maps capture early US cities and the landscape of discrimination
Unearthing Namibia’s forgotten genocide through forensic archaeology
Patty Heyda does not work for, consult, own shares in or receive funding from any company or organization that would benefit from this article, and has disclosed no relevant affiliations beyond their academic appointment.


Comments