Disappearing lakes, old photos and AI are helping scientists map Arctic permafrost thaw in near-real time
Published in Science & Technology News
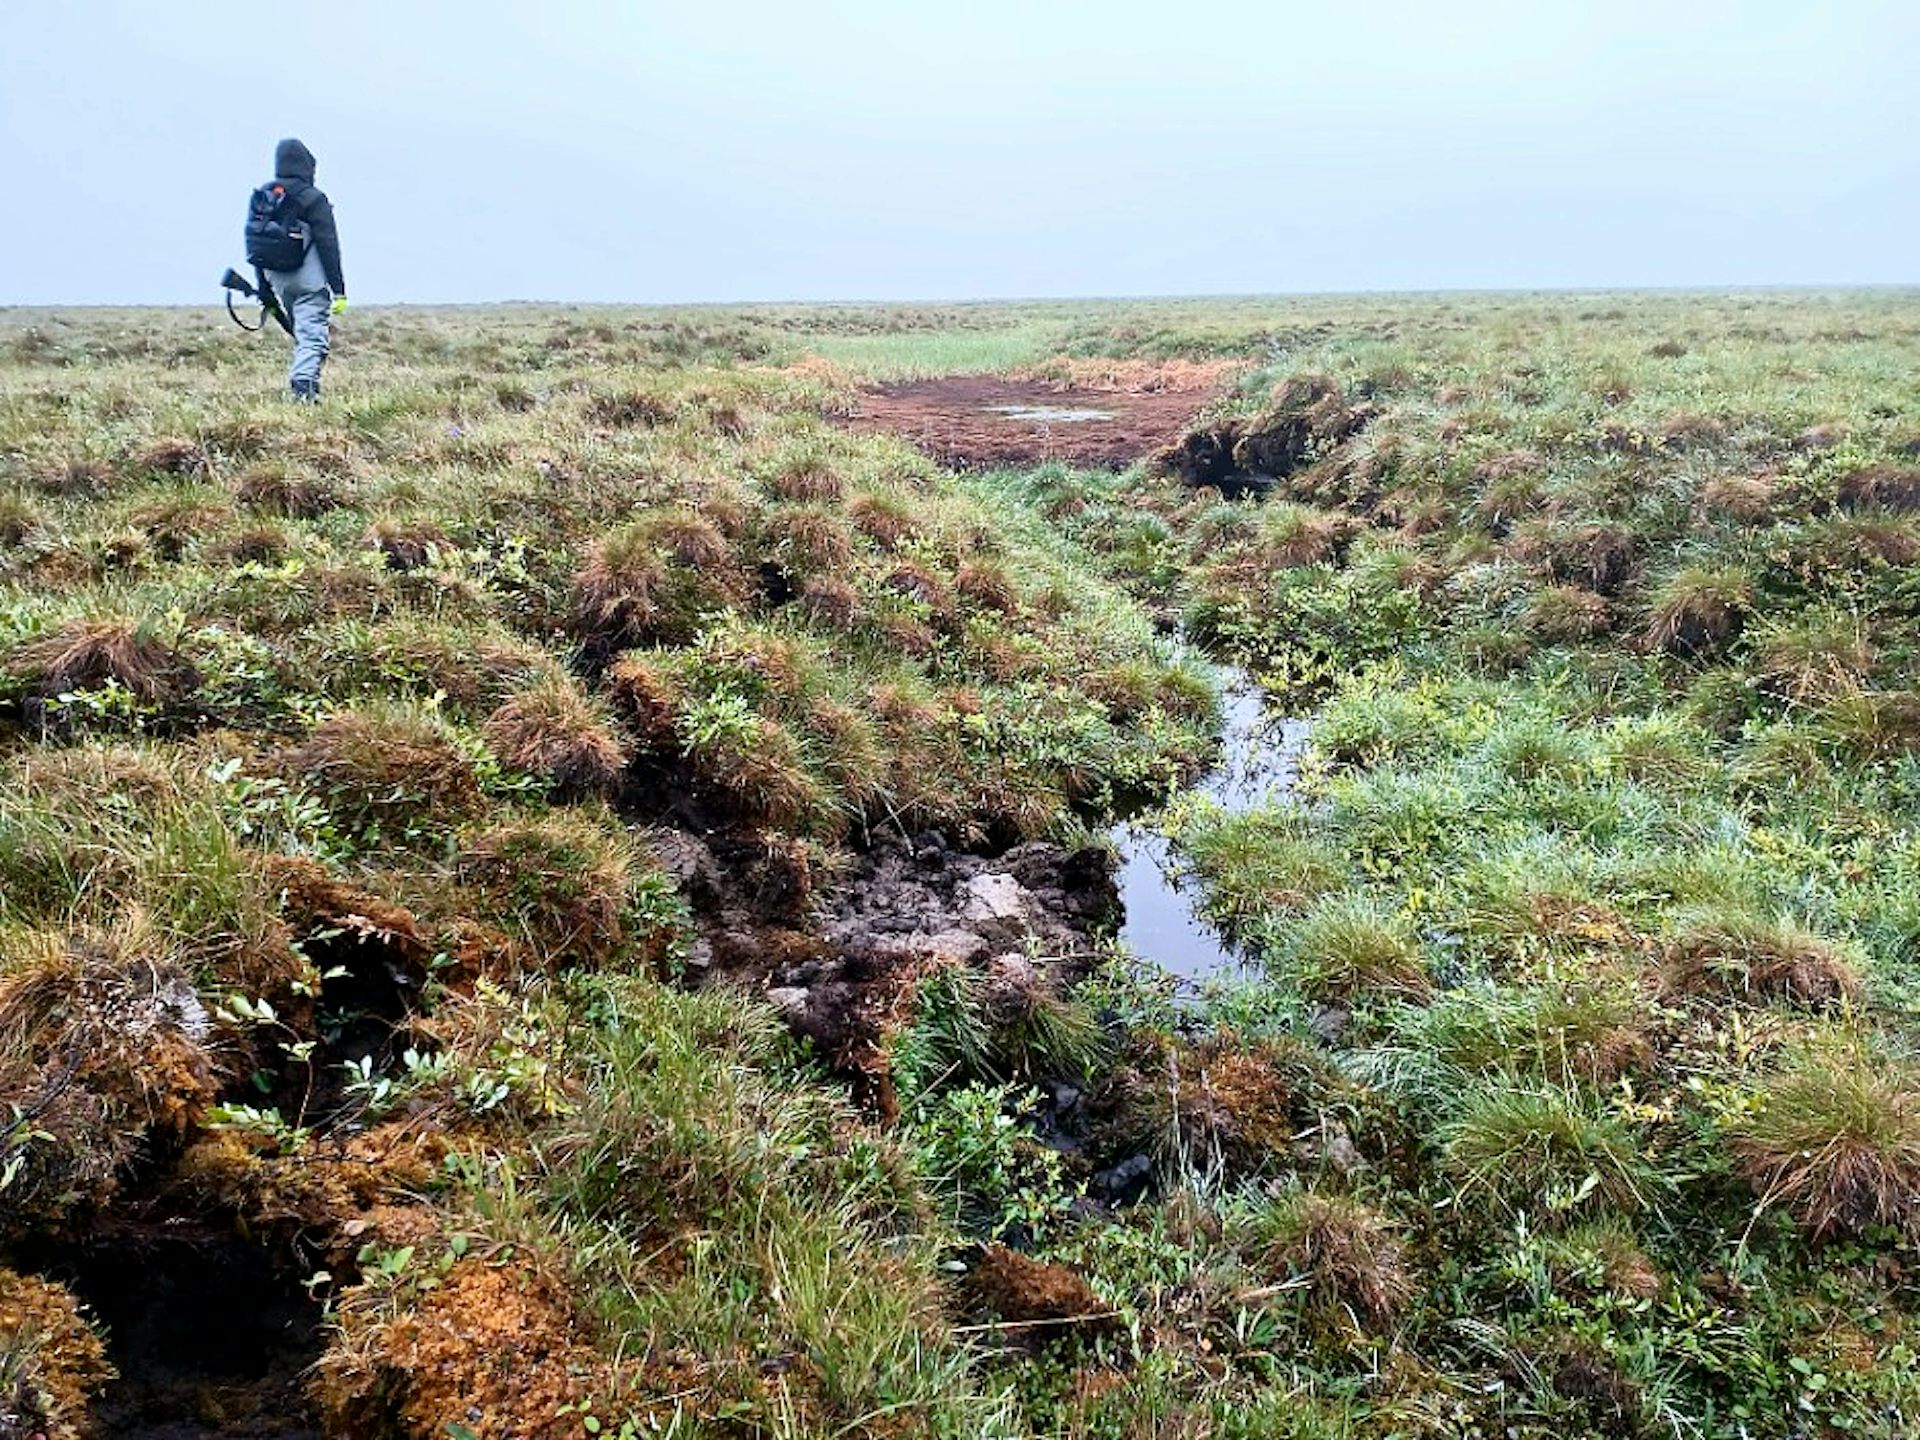
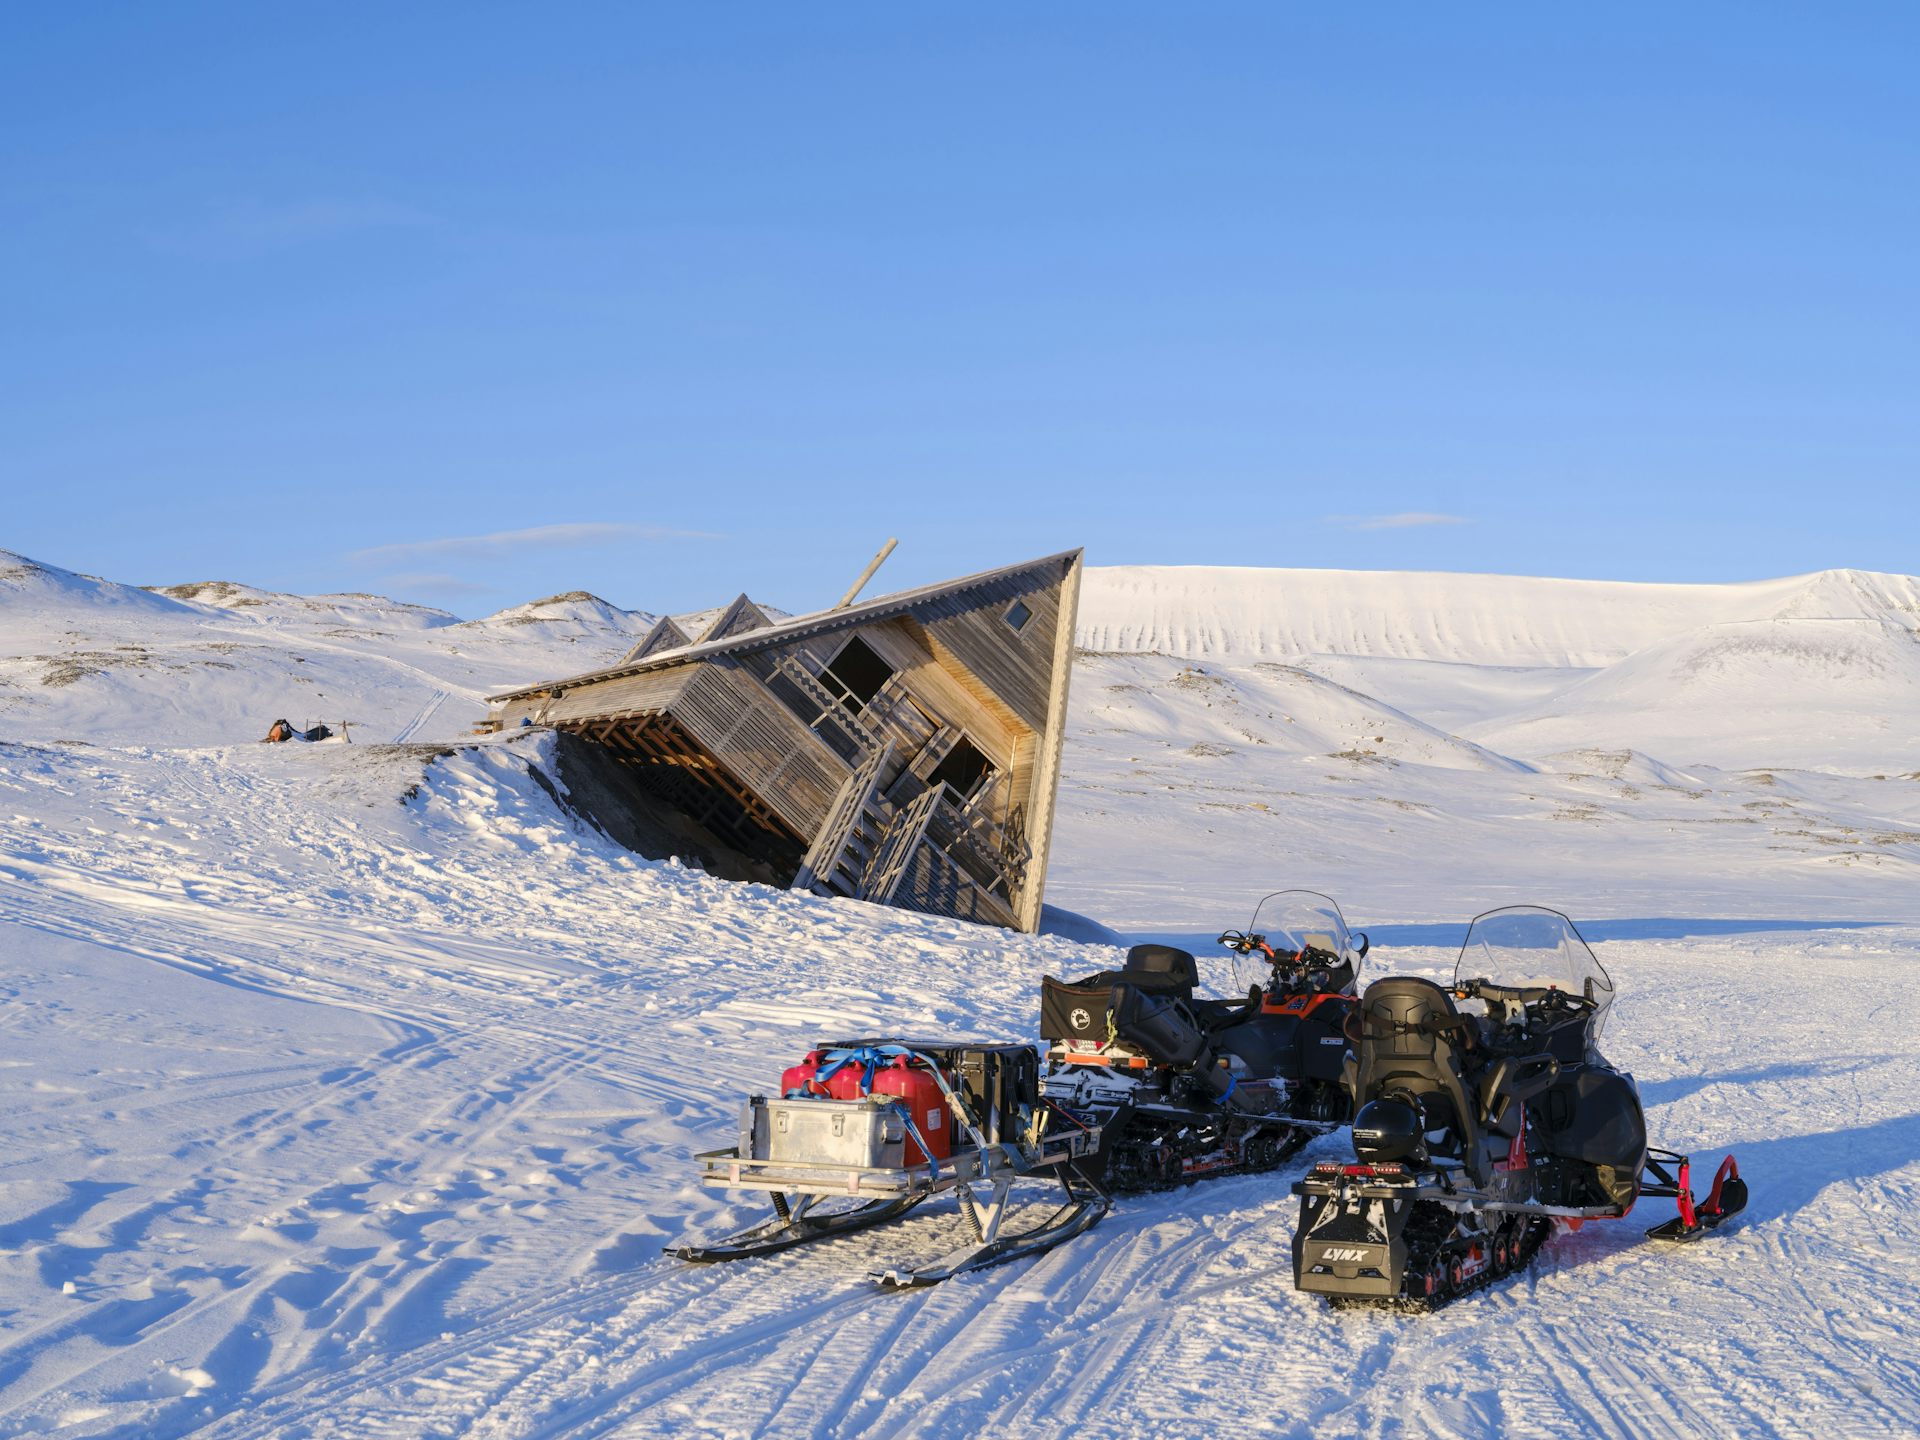
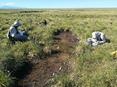
Florida gets a lot of attention for its sinkholes, especially when they swallow cars and entire houses. But its sinkhole risk has nothing on Alaska’s.
Much of Alaska’s soil is permafrost – ground that remains below 32 degrees Fahrenheit (0 degrees Celsius) for at least two consecutive years. It is often rich with ice, but when that ice melts, the ground can collapse. As temperatures rise, that’s happening more often across the Arctic.
The consequences are the same as in Florida: substantial property damage as the land that buildings, roads and pipes were built on sinks.
Yet despite the high potential for damage, up-to-date maps of permafrost thaw that could help Arctic residents and community leaders prepare are often rare. To fill in the gap, our team, led by hydrologists and data scientists, created an interactive website to track permafrost thaw in near-real time across the Arctic, using a unique quality of the Arctic’s version of the sinkhole.
There is no way to directly measure permafrost without digging into it, but there are signs to watch for.
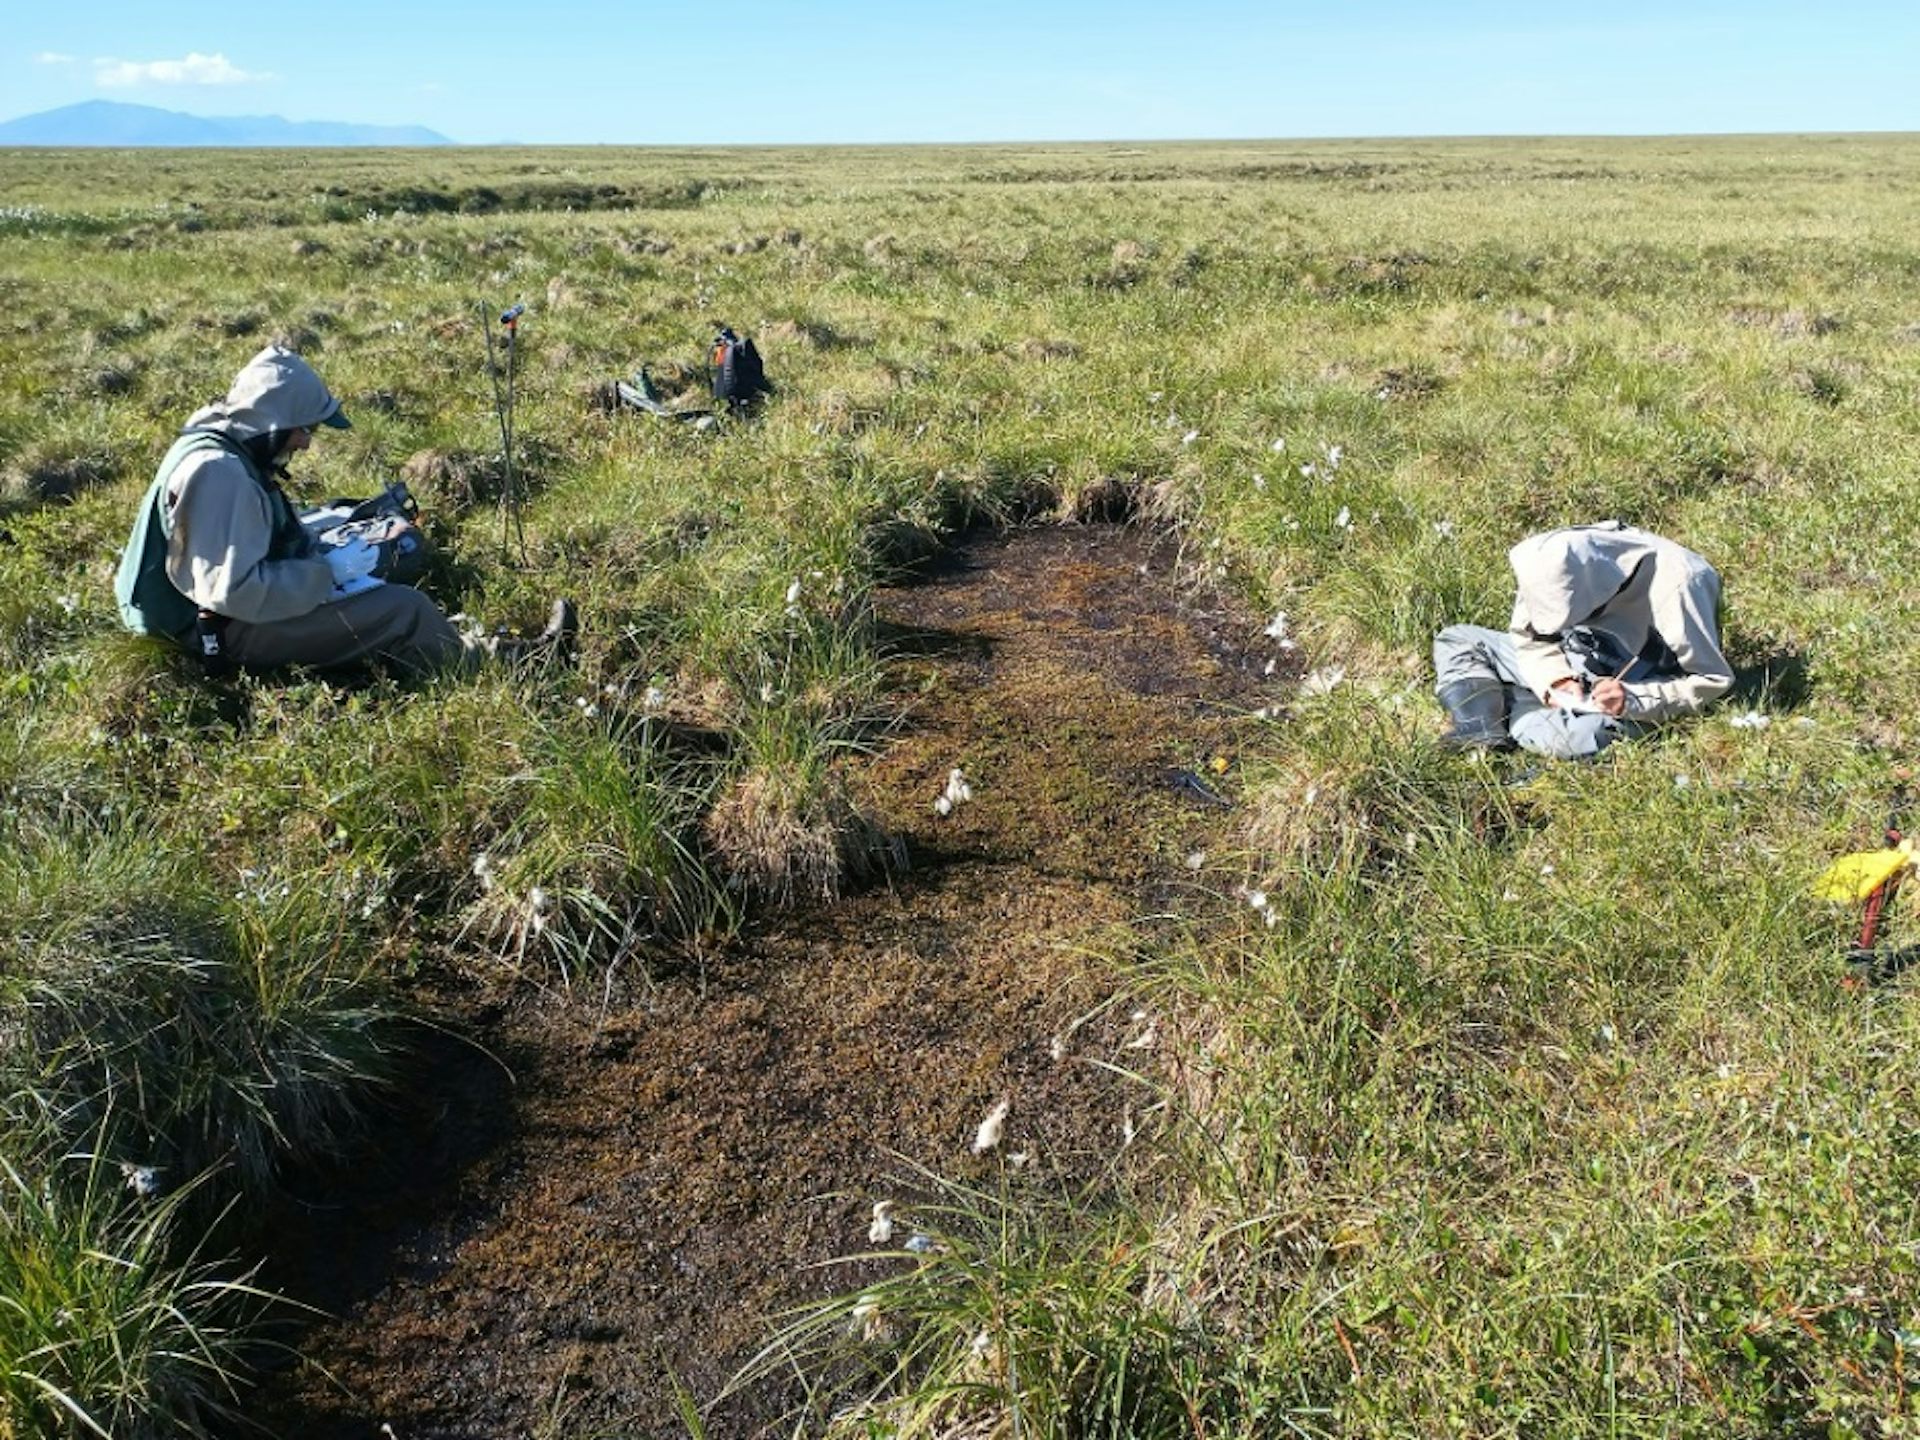
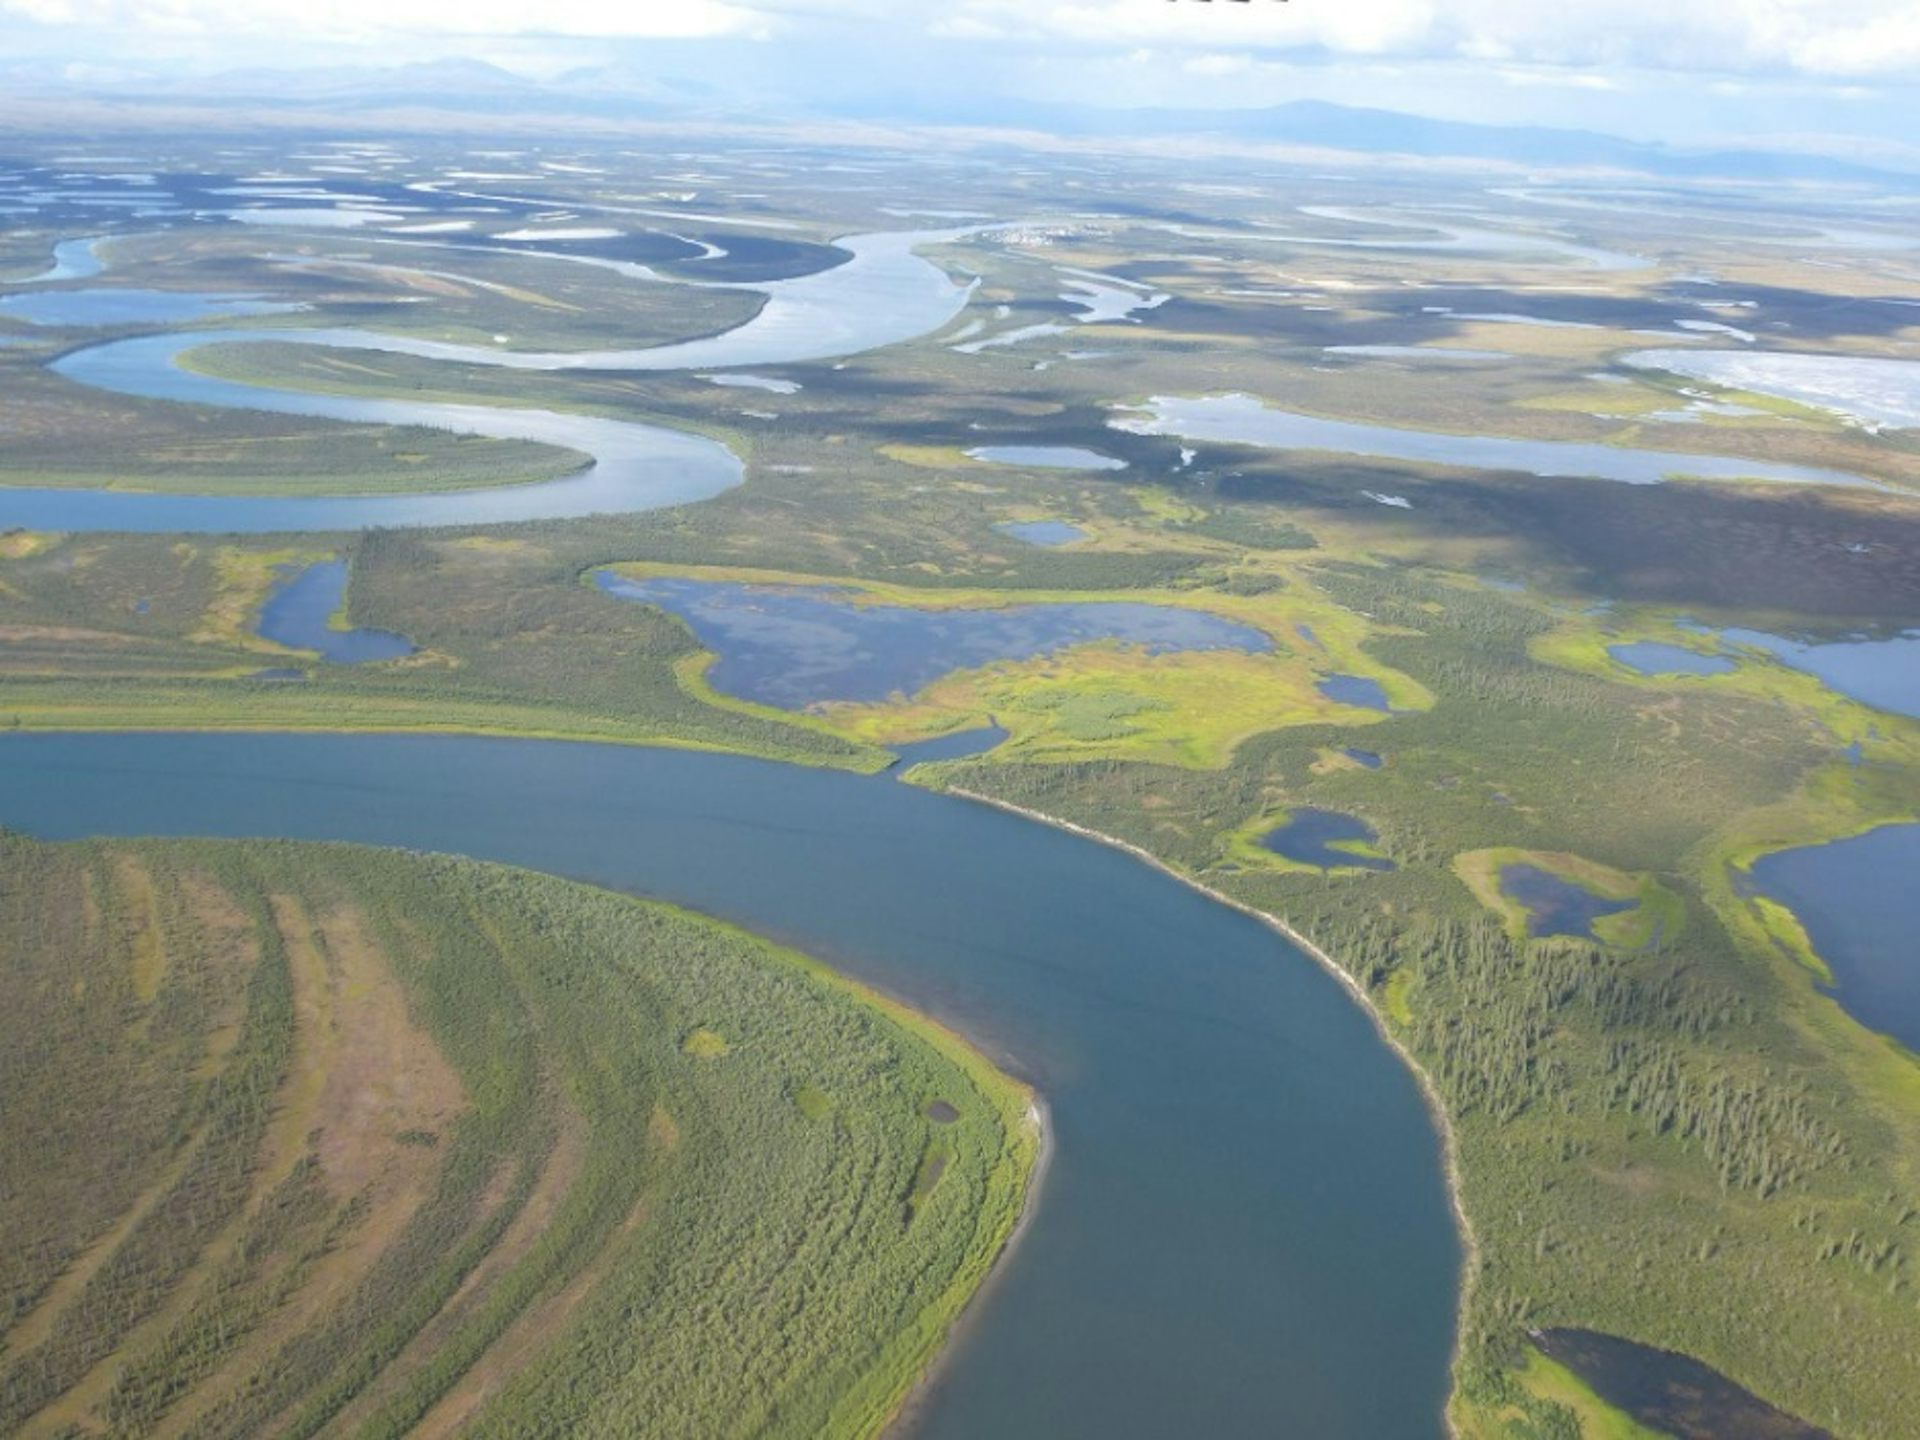
When ice-rich permafrost thaws, the ground surface subsides, creating what are known as thermokarst ponds – depressions that fill with water. Much of the Arctic has become dotted by ponds and lakes that formed this way, as temperatures there rise at two to three times the global average rate.
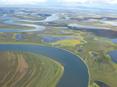
Looking at satellite imagery, it’s easy to spot these lakes. Watching how they change over time can then provide clues to how the permafrost is changing below.
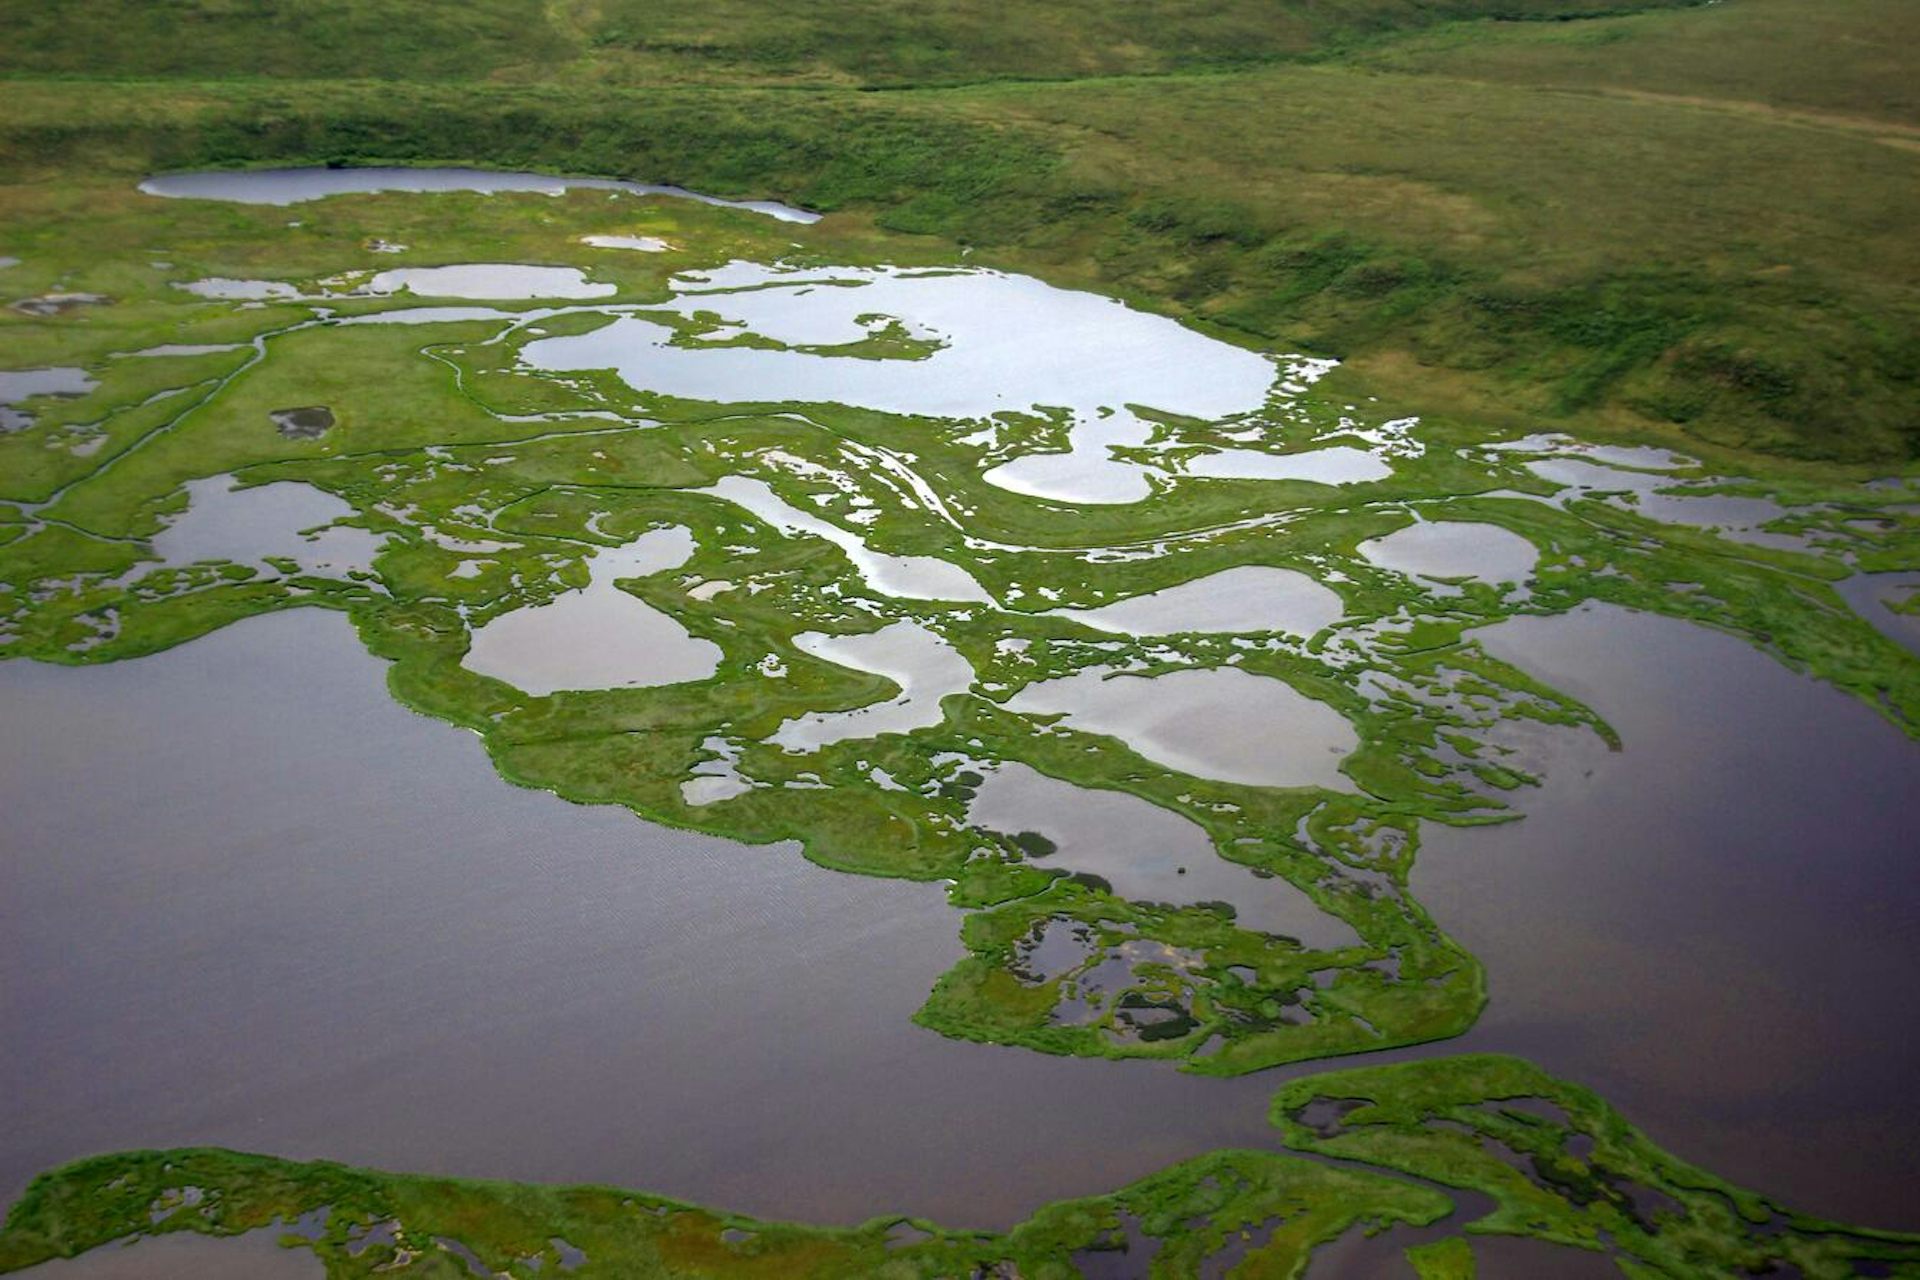
Sometimes, the same process that started the sinkhole can form new stream channels that drain the lake, leaving a circular basin of bare ground behind. A lake that is several hundred meters long might have taken a millennium to form, yet permafrost thaw triggered by one unusually warm summer can completely drain the same lake in just a few hours.
When a lake abruptly disappears, that’s a strong indicator that the ice-rich permafrost has thawed. Disappearing lakes also provide a way to monitor permafrost over wide areas and track where thawing is most active.
Aerial photos starting from the late 1940s and satellite imagery that became available in the 1970s have helped scientists map what the Arctic’s permafrost landscapes looked like in the past, including where its permafrost lakes were and were not.
Using artificial intelligence, scientists can then quickly analyze new images from across large swaths of the Arctic for signs of permafrost changes, such as the appearance of new ponds or the disappearance of old ones.
An international team of scientists we work with through the Permafrost Discovery Gateway has mapped and now actively monitors over 4 million lakes across the Arctic, including 70 million thermokarst ponds – also known as trough ponds – across the Alaska tundra.
Detecting signs of permafrost thaw in those landscapes can help communities plan for changes to their environment. The new maps can show where land is underlain by ice-rich permafrost, meaning bad choices for building sites, and where the frozen soil has less ice, likely indicating it’s safer for building sites.
The Seward and Baldwin peninsulas in northwestern Alaska are hot spots for lakes suddenly draining.
Over the past two decades, this region lost many large lakes that had covered its landscape for thousands of years. In the summer of 2018 alone, almost 200 of the region’s approximately 4,600 lakes lost more than a quarter of their area following an unusually warm winter.
Although winter 2025-26 was on the cold side for Alaska, this region continued to lose lake area – suggesting evidence of permafrost thaw. We found around 30 more lakes that were affected by drainage in June and July 2026.
This process happens with hundreds of lakes across the Arctic every summer, especially in June and July. However, not all lake changes are caused by permafrost thaw.
For example, it is not uncommon that lakes in floodplains and wetlands change dramatically across each season due to the abundance of snowmelt water in spring. Wildlife can also play a role. Beavers, for example, can recreate a lake after it abruptly drained by blocking the newly formed drainage channels.
In the past, information about where permafrost was changing was primarily available through scientific studies published years later.
With near-real-time data available today, researchers can more closely study the processes of permafrost thaw, and communities can get up-to-date insights about the status of the permafrost before they plan new construction, and know where they’re likely to have trouble.
This article is republished from The Conversation, a nonprofit, independent news organization bringing you facts and trustworthy analysis to help you make sense of our complex world. It was written by: Anna Liljedahl, University of Alaska Anchorage and Ingmar Nitze, Alfred Wegener Institute Helmholtz Centre for Polar and Marine Research
Read more:
From record warming to rusting rivers, 2025 Arctic Report Card shows a region transforming faster than expected
Arctic rivers face big changes with a warming climate, permafrost thaw and an accelerating water cycle − the effects will have global consequences
Thawing permafrost is roiling the Arctic landscape, driven by a hidden world of changes beneath the surface as the climate warms
Anna Liljedahl receives funding from Google.org Impact Challenge on Climate Innovation, the National Science Foundation (Awards #1927872, 2052107, 2234117), and Woodwell Climate Research Center.
Ingmar Nitze receives funding from Google.org Impact Challenge on Climate Innovation, the National Science Foundation, Schmidt Sciences Virtual Institute for the Carbon Cycle (VICC), and the Alfred Wegener Institute Helmholtz Centre for Polar and Marine Research.






Comments