Eddie Brown: Stop hating on math: 9 advanced metrics that can win your fantasy football league
Published in Football



I have never understood why hating math is one of the few intellectual aversions people advertise so freely.
Nobody walks into a restaurant bragging about hating literacy. Mention algebra, though, and otherwise reasonable adults start describing seventh grade like a combat tour.
Maybe it’s the way math was taught: too much memorization, too many timed tests and too many teachers insisting you show your work after you reached the correct answer through a method apparently unacceptable to the state.
Miss a question in English class and perhaps the red door symbolizes something else. Fail to solve a quadratic equation and the answer is simply wrong. No appeals. No replay review.
Or maybe we confused calculation with math. Calculation is only its boring dialect. It’s what your phone does when you tip 20%.
Math is the creative part: recognizing patterns, defining relationships and using what we know to figure out what we don’t.
It’s also everywhere.
Math tells your GPS where you are, meteorologists where a storm is headed and engineers whether a bridge will stay where they put it. It also tells an algorithm that watching one cast-iron skillet video means you would now like to see every pan ever manufactured.
Math is the hidden language underneath modern life. More important here, it helps humans make educated guesses about the future. We can predict the trajectory of objects billions of miles away or model the movement of something microscopic through a population.
Surely we can use some of that power to decide whether to draft a receiver in Round 5.
Fantasy football still begins with opportunity, but advanced metrics help separate sustainable production from statistical junk food. They can’t predict the future, but they can make our guesses considerably smarter.
Here are nine worth knowing.
And if they keep us from drafting the wrong guy, maybe algebra deserves an apology.
EPA per dropback (QB)
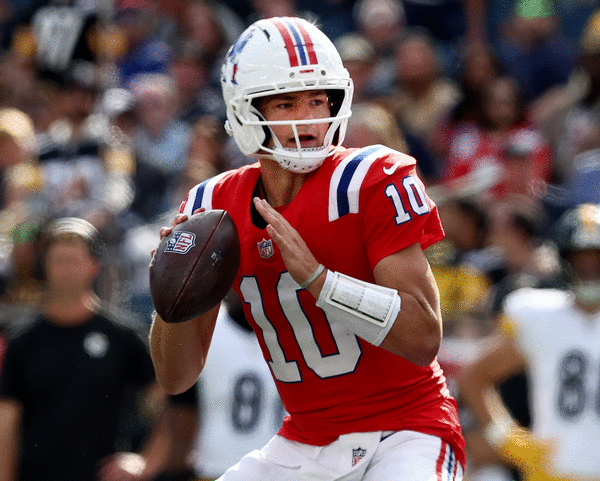
Expected Points Added measures how much each play changes a team’s expected scoring outcome. For quarterbacks, it gives us a better picture of efficiency than raw passing yards. Drake Maye’s 2025 breakout became impossible to dismiss as the season progressed; by Week 17, he led the NFL at plus-0.24 EPA per dropback. Only Josh Allen finished with more fantasy points among quarterbacks. Fantasy points usually pool around efficient offenses.
Completion percentage over expected (QB)
CPOE asks whether a quarterback completes more throws than expected based on their difficulty. It helps separate actual accuracy from a player padding his percentage with screens and layups. Maye had positive CPOE in eight straight games by late October and led the league at plus-10.8%. EPA tells us whether the offense works; CPOE helps explain whether the quarterback is driving it.
Rushing yards over expected per attempt (RB)
Next Gen Stats estimates what a runner should gain based on blocking, defenders, speed and positioning, then compares it with reality. Positive RYOE identifies backs creating beyond what the play gives them. James Cook led the NFL with plus-358 rushing yards over expected in 2025 while winning the rushing title. Volume matters, but turning those opportunities into extra yards is what can win you leagues.
Missed tackles forced rate (RB)
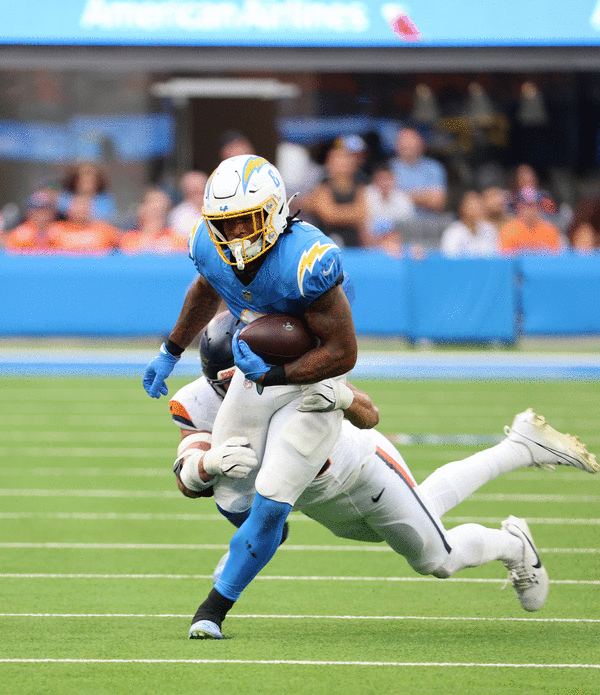
This measures how often a runner makes a defender miss and is especially useful when poor blocking distorts yards per carry. Chargers rookie Omarion Hampton forced a missed tackle on 25.8% of his 2025 carries, third among qualified backs, while averaging 16.5 fantasy points in the eight games he received at least 15 touches. That is the profile of a player who can turn increased opportunity into a breakout.
Running back opportunity share (RB)
Carries plus targets are the currency. Snap share can mislead because a back can spend 50 snaps blocking. Opportunity share tells us who is actually getting the ball. Add carries inside the 5 and you can separate an empty workload from a touchdown-rich workload. Javonte Williams turned Dallas’ lead role into 1,201 rushing yards and 13 total touchdowns last season.
Route participation (RB/TE)
This is especially important for tight ends and pass-catching backs. Being on the field is irrelevant if you are staying in to block. Late last season, Colston Loveland ran about three-quarters of Chicago’s routes over the final four games while drawing a target on roughly 35% of them. That is role expansion worth chasing.
Targets per route run (WR/TE)
Raw targets can lie because they depend on playing time. Target rate tells us how often a player earns the ball when he actually runs a route. Chicago’s Luther Burden III posted a 26% target rate over the Bears’ final eight games, including the playoffs. If his routes rise in 2026, the underlying math says the targets should follow.
Yards per route run (WR/TE)
YPRR combines opportunity and efficiency by dividing receiving yards by routes run. George Pickens averaged about 2.4 yards per route in 2025, tied for fifth among wideouts with at least 75 targets, during his breakout season in Dallas. It is one of the cleanest ways to identify receivers doing more than merely accumulating statistics because they never leave the field.
Air-yards share (WR/TE)
Target share tells us how often a player is thrown to. Air-yards share tells us how much of an offense’s downfield opportunity belongs to him. A receiver commanding 25% of the targets and 40% of the air yards has a different ceiling than one collecting checkdowns. This can reveal fantasy production before it appears in the box score.
©2026 The San Diego Union-Tribune. Visit sandiegouniontribune.com. Distributed by Tribune Content Agency, LLC.






Comments