Biden and Trump, though old, are both likely to survive to the end of the next president’s term, demographers explain
Published in Political News


In a recent poll, 67% of Americans surveyed believe that President Joe Biden, 81, is too old to serve another term as president. But only 41% of respondents said they feel that way about former President Donald Trump, who is 77. Both men have stumbled around and have forgotten or mixed up names and events, which are behaviors that characterize some older people.
We are demographers – not scholars of brain function considering people’s cognitive abilities. But there is a question we can answer, one that speaks to concerns about both men’s ages: their life expectancy.
And it turns out that the four-year age difference between Biden and Trump isn’t really much of a difference when it comes to their respective odds of surviving. The statistical odds are good that both would complete a four-year term as president.
We know this because of one of the most versatile tools of demography, which is called a life table. It’s a table of age groups, usually from 0 to 100 years, showing the percentages of the population at any age surviving to a later age. It is based on the age-specific death rates of the population.
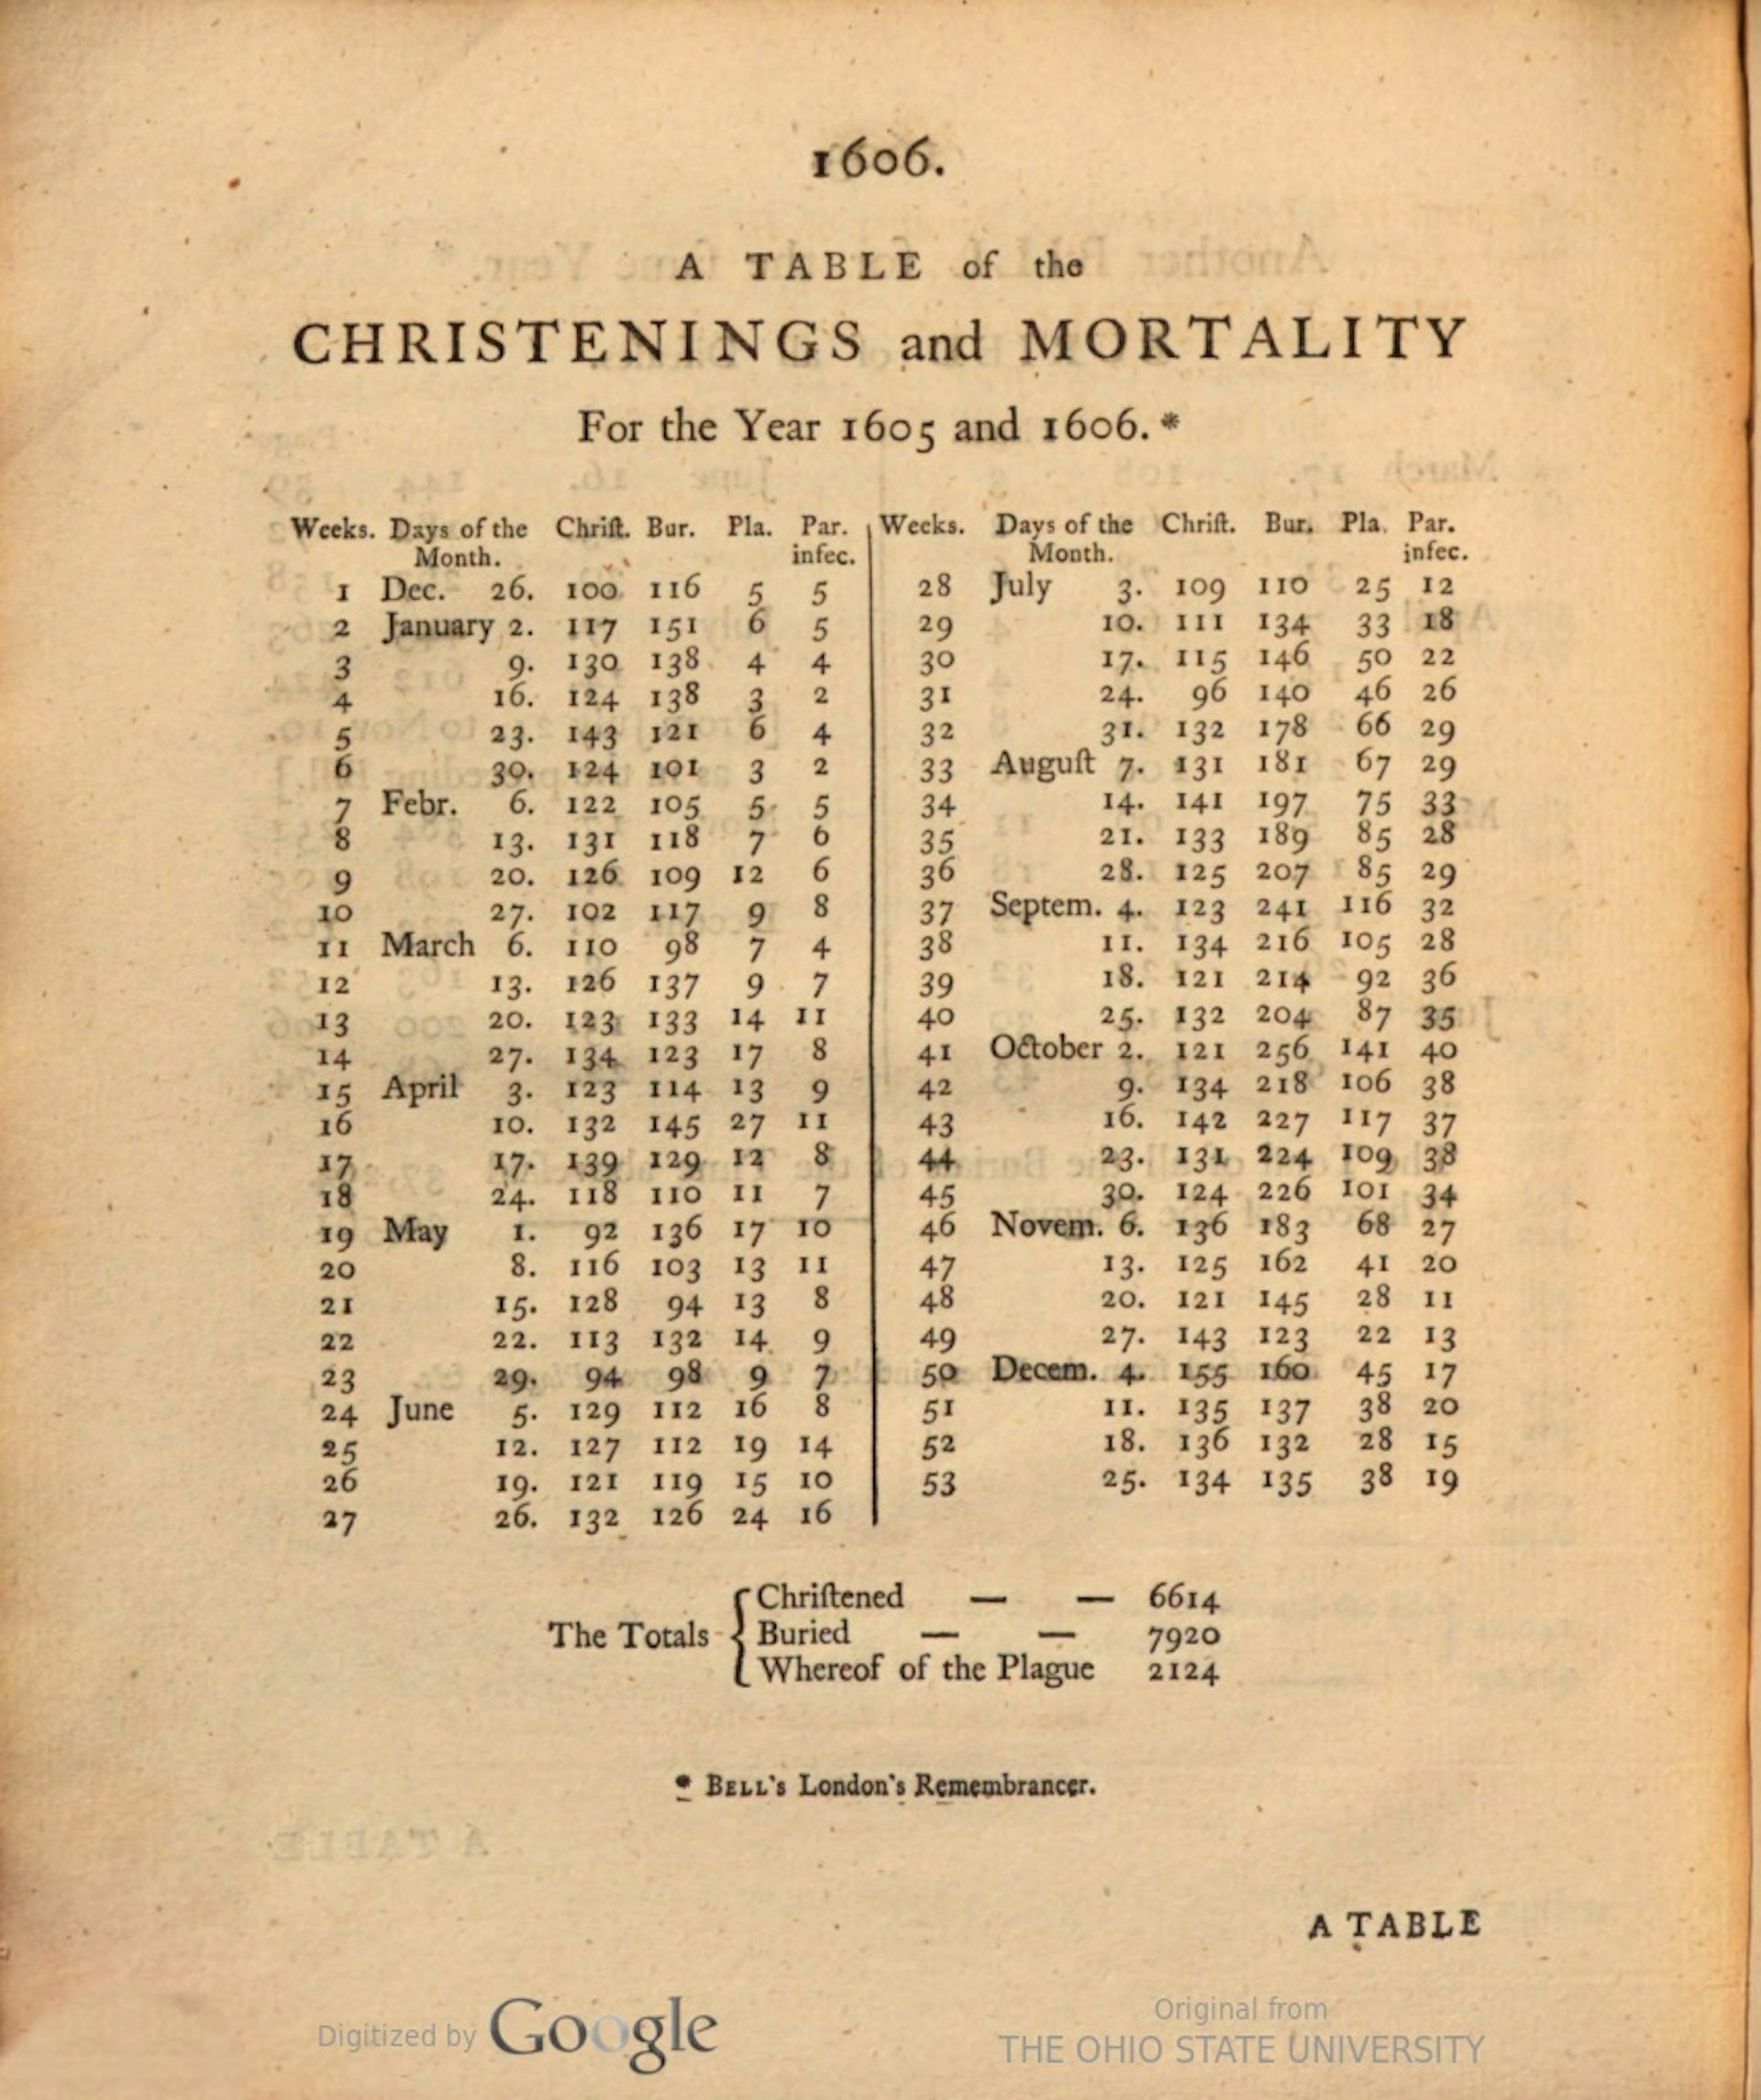
The life table dates back to John Graunt, a self-educated citizen of London in the 17th century who is known by many as the founder of demography. In 1662, Graunt produced and distributed the first life table, showing the probabilities of London’s population surviving from one age to the next.
There are two kinds of life tables. The first is a cohort life table, which represents the death rates and ages for a specific group of people. A cohort table could, for example, document the deaths of all males born in the U.S. in 1940. That table would be very precise, but it wouldn’t be complete until every member of the group had died – so it’s not especially useful for examining the prospects of the living.
As a result, demographers more often use life tables for a current time period, such as the year 2021, which is the date of the most current period life table for the U.S.
It shows the probabilities of surviving from one age to another age based on the death rates in 2021.
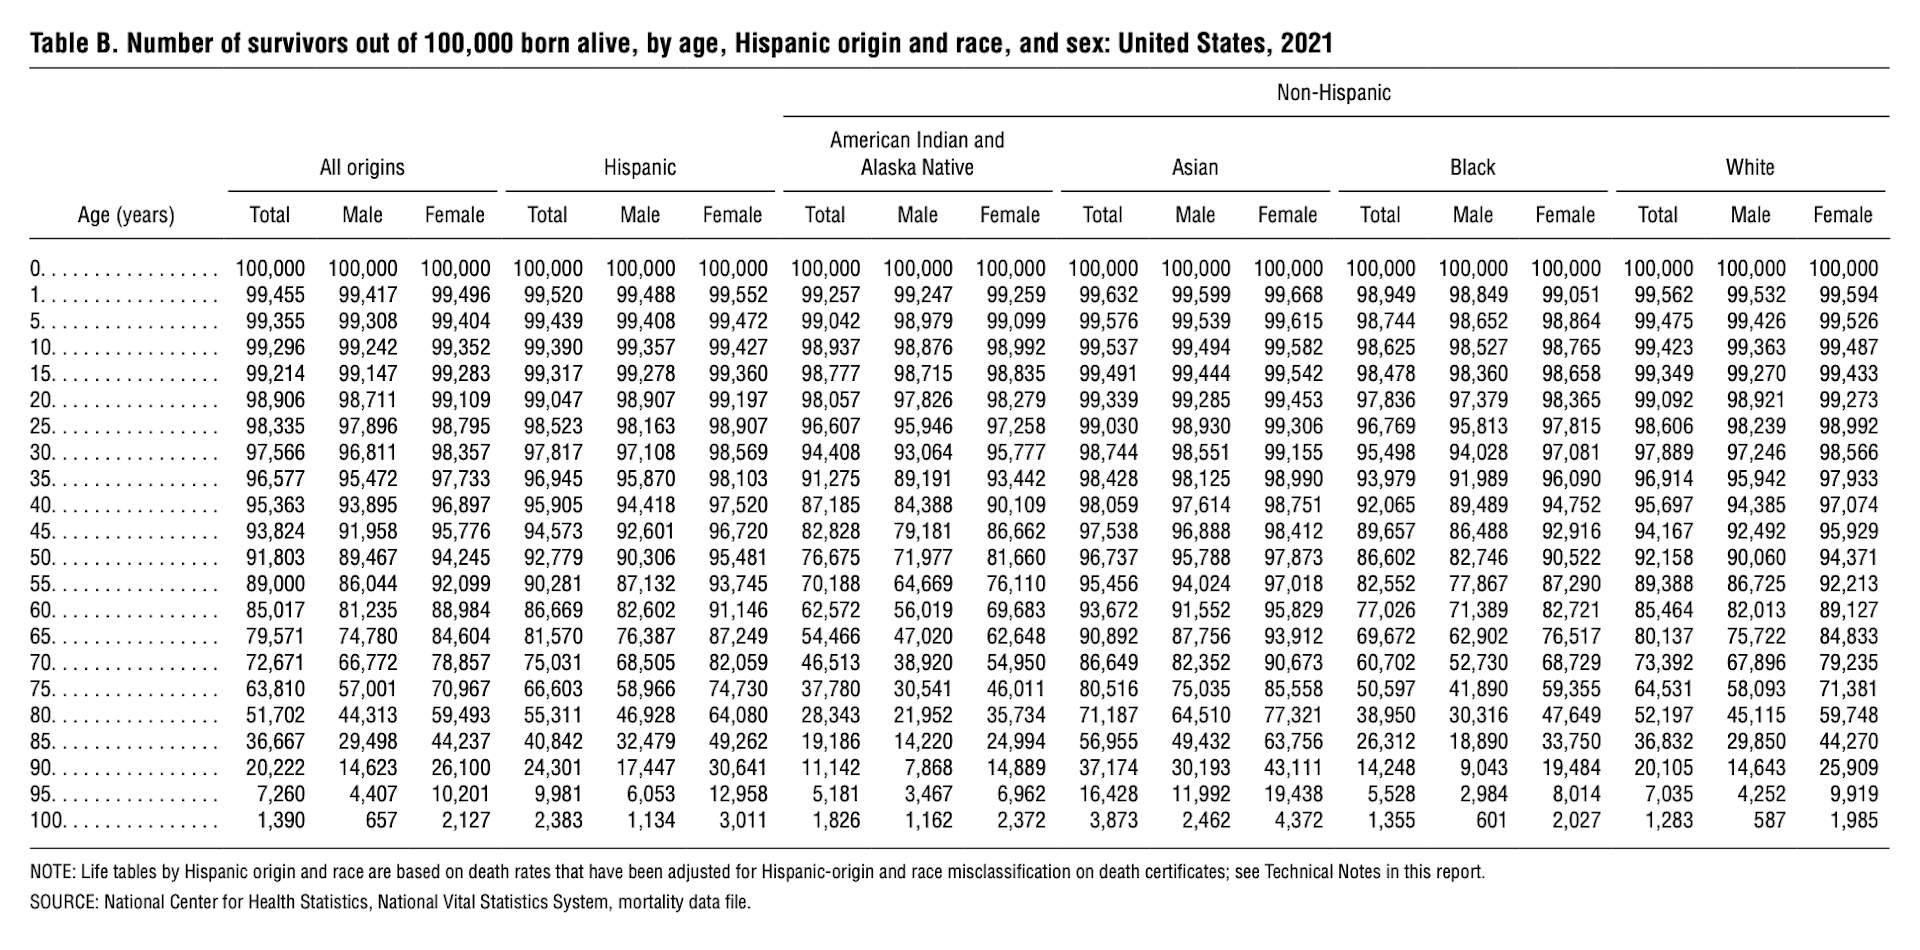
A period life table for 2021 indicates that almost 99% of all people born in the U.S. survive from age 0 to age 20; just over 95% of them survive to age 40, and over 85% to age 60. More than 51% of them live to age 80.
But life tables get much more specific. It’s important to examine life tables’ data for each age, race and gender combination. This is because males don’t live as long as females, Black people don’t live as long as white people, and non-Hispanic people don’t live as long as Hispanic people. There are more specialized life tables that focus on education level and income, but they are not as current and complete as the broader tables.
...continued


Comments